Latest Version
Version
0.1.5
0.1.5
Update
December 23, 2024
December 23, 2024
Developer
Number Analytics LLC
Number Analytics LLC
Categories
Design
Design
Platforms
Android
Android
Downloads
0
0
License
Free
Free
Package Name
com.numberanalytics.app
com.numberanalytics.app
Report
Report a Problem
Report a Problem
More About Number Analytics
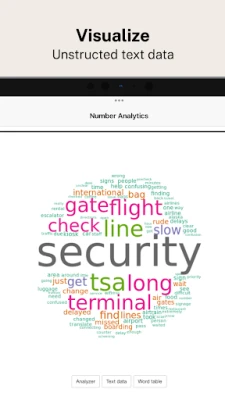
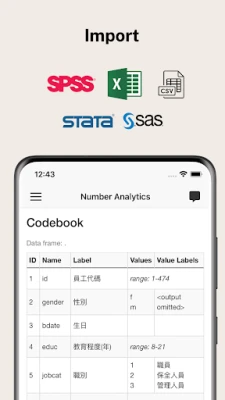
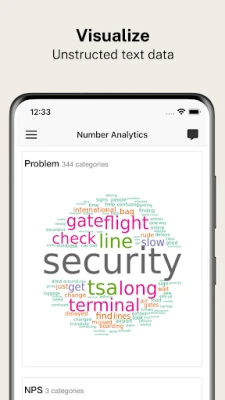
Number Analytics is a statistical software for advanced statistical tests, regression analysis, text analysis, and survival analysis. It supports multiple data formats like SPSS, Minitab, Excel, CSV, STATA and SAS. The software provides powerful graphs and tables for mean difference tests (T-test, ANOVA), linear regression, logistic regression and K-means clustering. Text cloud visualization enables you to analyze unstructured customer feedback text data in seconds. Easily analyze your data anytime, anywhere with smartphones and tablets.
Statistical analysis is critical to improving business, society, and how we live. Market research for new product development, social science research at universities, and medical research at hospitals are all looking for interesting, statistically significant data patterns based on actual, experimental, or survey data. Number Analytics is designed for users who are not good at coding and statistics, but need to quickly and easily analyze various types of data for their research on their mobile devices.
In the past, analyzing data meant spending hours preparing data, summarizing summary statistics, performing numerous statistical analyses based on hypotheses, and finding statistically significant relationships between variables. Especially for beginners, selecting the right statistical models and interpreting the results are the pain points and require considerable time and effort. Now it can be done with clicks and automation that can speed up the process at least 10 times.
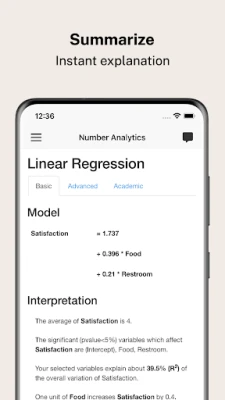
With Number Analyzer, the computer will automatically apply these statistical models and explain the statistical results in plain English.
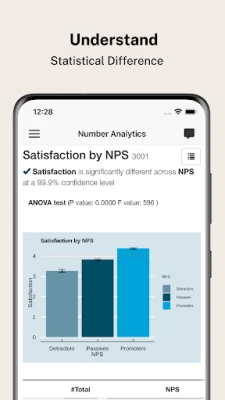
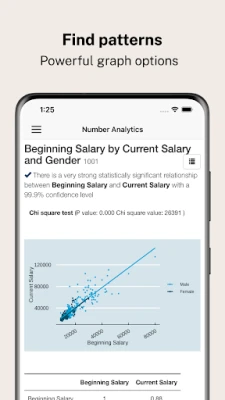
Because the computer knows which statistical models to use, you can run more than 100 statistical analyses at once. The statistical results, such as linear regression and ANOVA, show not only statistical test results, but also graphs with confidence intervals and marginal effects, and tables coded with statistical differences between subgroups.
To upload your own data, first download or move your data to iCloud storage. Then click the Upload button in the Data section. You can easily upload and use the data. Various data formats are supported including labelled survey data (SPSS).
Currently the upload file size is limited to 2Mb.
For those who received the activation code from your organization (universities or companies), enter the code at the Upgrade page under Account.
Descriptive statistics
-Summary Statistics
-Frequency Table
-Crosstab (Chi-sq. Test)
-Pivot table
-Correlation
-Text analytics
Mean Difference test
-One Sample T-test
-Paired Sample T-test
-Independent Samples T-test
-ANOVA (Analysis of Variance) test
Regression Analysis
- Linear Regression
- Fixed Effect Regression
- Logistic Regression
Clustering Analysis
- K-Means Clustering
Survival Analysis
-Kaplan Meier plot
Rate the App
Add Comment & Review
User Reviews
Based on 0 reviews
No reviews added yet.
Comments will not be approved to be posted if they are SPAM, abusive, off-topic, use profanity, contain a personal attack, or promote hate of any kind.
More »
Other Apps in This Category
More »


![Delta Touch [9 x Doom engines]](https://sokig.xyz/images/pixel.png)


Popular Apps

Perplexity - Ask AnythingPerplexityAI

Client Record-Customer CRM AppSiyami Apps, LLC

Pocket CRM - Customers & LeadsVividSphere LLP

Clients — your client databaseClients
![Delta Touch [9 x Doom engines]](https://sokig.xyz/images/1733370544.webp)
Delta Touch [9 x Doom engines]Open Touch Gaming

True Phone Dialer & ContactsHamster Beat

ContactsSWEG ENTERPRISE

ContactsGoogle LLC

Doomsday: B.DuckIGG.COM

Derivative Calculator w/StepsDavid Scherfgen
More »


Editor's Choice

Miro: your visual workspaceRealtimeBoard

Oracle AnalyticsOracle America, Inc.

Number AnalyticsNumber Analytics LLC

Adobe Analytics dashboardsAdobe

Databox: Analytics DashboardDatabox, Inc.

Idle Miner Tycoon: Gold & CashKolibri Games

Software testing guideWe test it! by Radu Ola

ContactsGoogle LLC

True Phone Dialer & ContactsHamster Beat

ContactsSWEG ENTERPRISE
